November 11, 2020Banks continue to tighten lending standards in the face of persistent economic uncertainty. Mortgage delinquencies and foreclosures are up, but the overall health of the mortgage market is stronger than the headlines suggest. And the rent keeps getting paid at professionally managed buildings.Lending standards tightened further in 2020's third quarter
Don't read too much into seemingly big increases in delinquency & foreclosures
Rental payment rates continue to hold firm
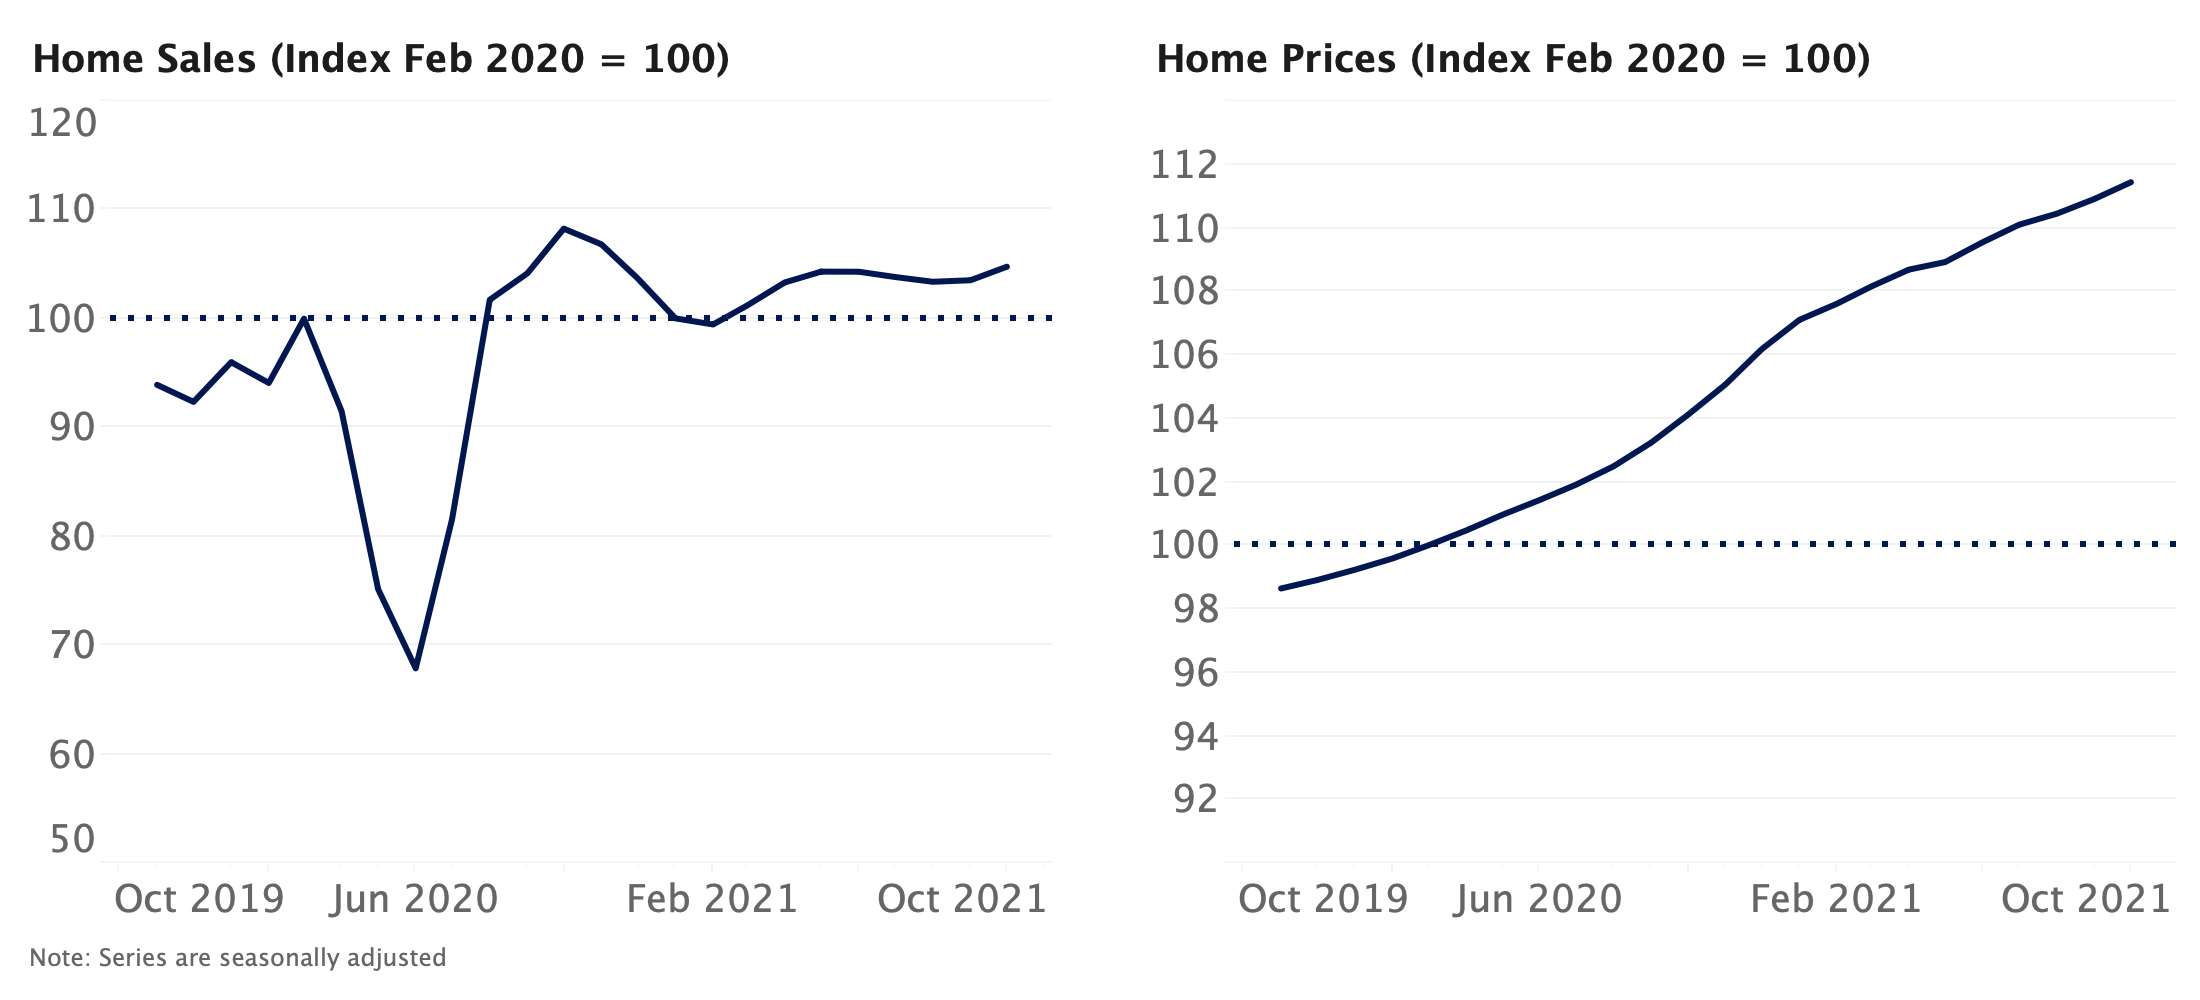
So what?Despite the fact that many sectors of the economy experienced meaningful improvements in Q3, banks further tightened lending standards on all loan types — including mortgages — citing a still-uncertain economic outlook. The net percentage of banks applying more stringent criteria to their mortgage lending practices was far less than the net share in Q2 2020, when the difference between the share of banks tightening standards and the share loosening standards was more than 50 percentage points. Still, the Q3 reading was far above any reading prior to the pandemic. While the still-elevated level of tightening signifies that banks are being extremely cautious given the tentative economic outlook, mortgage lenders' restraint is likely also a product of demand. Mortgage rates have remained at or near all-time lows for months, something that has prompted a surge in demand both for home purchase loans and refinances. Applications for mortgages remain well above last year's levels, as well as levels from the past several years, even as purchase loan applications have slipped recently compared to prior weeks. Mortgage delinquencies and foreclosures increased in August and October, respectively, but those increases likely exaggerate any claims that the mortgage market is broadly unhealthy — though the data do point to some looming challenges for the market. CoreLogic's measure of "extremely delinquent" loans – those at least 150 days past due – reached its highest level ever in August, twice where it was in January 2010 at the height of the Global Financial Crisis. But the uptick is driven by widespread participation in mortgage forbearance programs, and encouragingly, the share of loans delinquent between 30-and-59 days fell year-over-year. The uptick in foreclosures was maybe more surprising, given participation in forbearance programs, but the notable monthly increase fails to account for the bigger picture. Even though foreclosures increased 20% in October from September, they remain down almost 80% year-over-year. Foreclosure activity remains very low overall, though an increase of some kind should be expected if/when forbearance programs expire in 2021. What impact that will have on the housing market remains to be seen, but early indications suggest that government support and high levels of accumulated home equity should dampen the impact. The share of households living in professionally managed apartment properties who made a November rent payment in the first week of the month fell slightly from last year's rate but not alarmingly so, continuing a trend that has played out since the early spring. The 1.1 percentage point difference in payment rates through November 6 2020 and 2019 was notably smaller than the annual differences recorded in the summer months. That said, the more-or-less steady payment rate may be masking some underlying issues plaguing the broader rental market. The report doesn't identify what share of the 80.4% of households that made a payment only paid part of their rent and/or were only able to stay current because of an accommodative arrangement made by their landlord that may require larger payments down the road. Additionally, this report only examines payment rates in larger, professionally managed rental properties which, in some cases, may have a larger financial buffer than landlords of smaller operations. Lastly, people's ongoing ability to make rent may fade going forward as savings generated from direct stimulus checks and other measures earlier in the year start to dwindle. Still, the fact that a key measure of rental rates hasn't plummeted is obviously a good sign for the state of the housing market. Click here to read past editions of Zillow’s Market Pulse updates. The post Zillow Market Pulse: November 11, 2020 appeared first on Zillow Research. via Zillow Market Pulse: November 11, 2020 https://ift.tt/32Ijcd0
0 Comments
November 11, 2020Banks continue to tighten lending standards in the face of persistent economic uncertainty. Mortgage delinquencies and foreclosures are up, but the overall health of the mortgage market is stronger than the headlines suggest. And the rent keeps getting paid at professionally managed buildings.Lending standards tightened further in 2020's third quarter
Don't read too much into seemingly big increases in delinquency & foreclosures
Rental payment rates continue to hold firm
So what?Despite the fact that many sectors of the economy experienced meaningful improvements in Q3, banks further tightened lending standards on all loan types — including mortgages — citing a still-uncertain economic outlook. The net percentage of banks applying more stringent criteria to their mortgage lending practices was far less than the net share in Q2 2020, when the difference between the share of banks tightening standards and the share loosening standards was more than 50 percentage points. Still, the Q3 reading was far above any reading prior to the pandemic. While the still-elevated level of tightening signifies that banks are being extremely cautious given the tentative economic outlook, mortgage lenders' restraint is likely also a product of demand. Mortgage rates have remained at or near all-time lows for months, something that has prompted a surge in demand both for home purchase loans and refinances. Applications for mortgages remain well above last year's levels, as well as levels from the past several years, even as purchase loan applications have slipped recently compared to prior weeks. Mortgage delinquencies and foreclosures increased in August and October, respectively, but those increases likely exaggerate any claims that the mortgage market is broadly unhealthy — though the data do point to some looming challenges for the market. CoreLogic's measure of "extremely delinquent" loans – those at least 150 days past due – reached its highest level ever in August, twice where it was in January 2010 at the height of the Global Financial Crisis. But the uptick is driven by widespread participation in mortgage forbearance programs, and encouragingly, the share of loans delinquent between 30-and-59 days fell year-over-year. The uptick in foreclosures was maybe more surprising, given participation in forbearance programs, but the notable monthly increase fails to account for the bigger picture. Even though foreclosures increased 20% in October from September, they remain down almost 80% year-over-year. Foreclosure activity remains very low overall, though an increase of some kind should be expected if/when forbearance programs expire in 2021. What impact that will have on the housing market remains to be seen, but early indications suggest that government support and high levels of accumulated home equity should dampen the impact. The share of households living in professionally managed apartment properties who made a November rent payment in the first week of the month fell slightly from last year's rate but not alarmingly so, continuing a trend that has played out since the early spring. The 1.1 percentage point difference in payment rates through November 6 2020 and 2019 was notably smaller than the annual differences recorded in the summer months. That said, the more-or-less steady payment rate may be masking some underlying issues plaguing the broader rental market. The report doesn't identify what share of the 80.4% of households that made a payment only paid part of their rent and/or were only able to stay current because of an accommodative arrangement made by their landlord that may require larger payments down the road. Additionally, this report only examines payment rates in larger, professionally managed rental properties which, in some cases, may have a larger financial buffer than landlords of smaller operations. Lastly, people's ongoing ability to make rent may fade going forward as savings generated from direct stimulus checks and other measures earlier in the year start to dwindle. Still, the fact that a key measure of rental rates hasn't plummeted is obviously a good sign for the state of the housing market. Click here to read past editions of Zillow’s Market Pulse updates. The post Zillow Market Pulse: November 11, 2020 appeared first on Zillow Research. via Zillow Market Pulse: November 11, 2020 https://ift.tt/32Ijcd0 
Grand Warszawski/Getty Images The standard pandemic narrative goes something like this: COVID-19 pushed renters into fleeing their tiny, claustrophobic apartments in the big, expensive cities—in turn causing monthly rents to plummet. However, it turns out that’s only partly true. Nationally, monthly rents continued to fall for studios, typically the smallest spaces, according to realtor.com®’s October rental report. However, they’re rising again for one-bedroom units and the more desirable two-bedroom abodes. The latter provides extra space, including an extra bedroom, which some folks are turning into makeshift offices. “We’re seeing the impact of workplace flexibility on rents. Renters are more free to pick up and move,” said realtor.com Chief Economist Danielle Hale. “They’re leaving expensive areas. They’re looking for more space and to cut back on expenses and spend less on rent.” That makes sense as folks fearing another pandemic-related lockdown are seeking out additional square footage—even if they stay in the big cities. Nationally, the median rent for a studio fell 0.8% year over year, to $1,316 a month in October, according to the report. But in a twist, rents shot up 1.1% for one-bedroom units, to a median $1,495 a month. For two-bedroom units, rents rose 2.6% annually, to $1,869. While two-bedroom rents are picking up, they’re still below the 3.5% annual growth rate before COVID-19. Realtor.com looked at rental prices in the 100 largest U.S. counties with at least 20 listings for studios, one-bedrooms, and two-bedroom units on the site. The rentals included apartments, condos, townhomes, and single-family homes. “Still in a lot of the biggest markets, two-bedroom rents are falling but not by as much. Everywhere people are looking for more space,” says Hale. “If you have the opportunity to trade up, a two-bedroom can make more sense than a smaller [unit].” Some renters may also be moving in with family and friends to save money—so all of a sudden that extra bedroom becomes a necessity. Nationally, the largest price cuts were in San Francisco, one of the nation’s priciest housing markets. Many renters who stuck around after some of the largest tech companies announced employees could work remotely until the summer or even indefinitely were able to score steep discounts. San Francisco studio rents fell 33.5% year over year, to a median $2,180 in October. The tech hub also saw drops of 26.3% for one-bedroom units, to $2,800, and decreases of 23.4% for two-bedroom rentals, to $3,810. Manhattan’s rental market also took a hit in a boon for renters. The median rent for a studio dropped 20%, to $2,395 a month. One-bedroom rents fell 16.7%, to $3,250, while two-bedroom rentals were 11.1% cheaper, at $5,333 a month. “These cities are expensive. They have a lot of workers who are working remotely now,” says Hale. “These are [also] cities that tend to attract a lot of students and recent graduates, and they’re probably not setting out for these cities right now.” The post Rental Prices Are Rising for These Big-City Apartments, but Falling for These Others appeared first on Real Estate News & Insights | realtor.com®. via Rental Prices Are Rising for These Big-City Apartments, but Falling for These Others https://ift.tt/3f7PYt3 
realtor.com A heavenly conversion of a historic Minnesota church made a divine impression on home shoppers. The transformed house of worship ascended to the top of this week’s 10 most popular homes on realtor.com®. Former churches make for intriguing single-family homes thanks to their impossibly tall ceilings, wide-open spaces, and stained-glass windows that let in streams of colored light. There’s also the connection with living in a home that served as a sacred space for so many. We’ve seen quite a few converted churches arise in our weekly accounting of the most popular properties—and for home buyers who want a home unlike any other, these holy houses make perfect sense. This example in Minnesota features cozy, carved-out spaces; a modern kitchen; and a smart use of space and existing architectural elements. Peep at the listing photos to see if you feel the spirit of inspiration move you. Aside from the converted church, you also clicked on a home owned by New York Yankees legend Andy Pettitte, a Washington, DC, mansion made for megafundraiser events, and a sprawling Bucks County farm dating to 1704. And, of course, there were a couple of quirky contenders this week, including a Kansas hunting lodge with a private gun range and an unfinished, solid cement house in Texas. However, it’s the church transformed into a family home that gets all the praise this week. And to that, we say, “Amen!” 10. 13969 S Maple Hollow Cir, Draper, UTPrice: $1,750,000 
realtor.com ——-- 9. 607 Pine Ridge Rd, Beech Mountain, NCPrice: $199,000 Highlights of the house in the woods include large windows, an oversize deck, wood-burning fireplace, as well as a sleeping loft accessed by a spiral staircase. The two loft bedrooms are separated by privacy panels and share a bathroom. 
realtor.com ——-- 8. 6550 Meetinghouse Rd, New Hope, PAPrice: $8,900,000 But the rest of the 6,323-square-foot, seven-bedroom home is strictly modern. The grounds include a patio, formal gardens, two-story bank barn, and lake house overlooking the lake and creek. 
realtor.com ——-- 7. 604 W Grand Ave, Yoakum, TXPrice: $374,000 The interiors could use some love, but they possess plenty of potential. There are a number of charming, one-of-a-kind details, including the outdoor meditation pond and bar, a greenhouse with shower, and wraparound porches. It even comes with a shed that could be converted into a guesthouse. 
realtor.com ——-- 6. 1224 30th St NW, Washington, DCPrice: $12,800,000 The grounds are meticulously groomed and feature greenhouses, a bowling green, herb garden, and boxwoods. Hosting large-scale events for visiting dignitaries is a breeze thanks to the entertaining pavilion with fireplace, a pool, and a four-bedroom guesthouse. 
realtor.com ——-- 5. 6550 Westcreek Cir, Fort Worth, TXPrice: $350,000 Whatever the finished product looks like, it’ll be a perfect spot to create the rooftop deck of your dreams. The listing notes that the concrete home can support up to 50 people on the roof or even a hot tub. The proposed five-bedroom structure was started way back in 1999, and it could be turned into a business, bar, or anything else a new owner dreams up. 
realtor.com ——-- 4. 6 Laurel Way, Purchase, NYPrice: $3,499,999 
realtor.com ——-- 3. 2117 Toledano St, New Orleans, LAPrice: $390,000 
realtor.com ——-- 2. 8486 SW Santa Fe Lake Rd, Augusta, KSPrice: $1,100,000 There’s also an observation tower and a huge entertainment space used as the “trophy room” with bar and sound system. Most important for a marksman who doesn’t want to leave the house, this place comes with an indoor rifle range. 
realtor.com ——-- 1. 60 W Main St, Lewiston, MNPrice: $269,900 And there’s even some customization work left for a buyer. A partly finished basement beckons a new owner to bless it with whatever her heart desires. 
realtor.com The post Hallelujah! Converted Church in Minnesota Is This Week’s Most Popular Home appeared first on Real Estate News & Insights | realtor.com®. via Hallelujah! Converted Church in Minnesota Is This Week’s Most Popular Home https://ift.tt/2GWHNms The number of days homes are staying on the market remains at a record-low in the face of intense and persistent buyer demand. Sales are at levels not seen since prior to the Great Recession and are expected to remain high, and prices continue to grow quickly. September was the best month for existing home sales since 2006
Time on market matches record lows
Scalding homebuyer demand continues to drive inventory lower
Price growth continues months-long stretch of uninterrupted annual growth
Homeowners that do decide to sell are realizing big gains. Median sale prices rose to $289,625 in the week ending Sept. 19 (the latest week for which sales price data is available), up 12.5% over the same period in 2019. Home value growth expected to continue accelerating in coming months
2020 home sales likely peaked in September, expected to reaccelerate early next year
¹Using the closest daily rates available from the Freddie Mac Primary Mortgage Market Survey. Monthly payments calculated with Zillow's Mortgage Calculator using 20% down payment.MethodologyThe Zillow Weekly Market Reports are a weekly overview of the national and local real estate markets. The reports are compiled by Zillow Economic Research and data is aggregated from public sources and listing data on Zillow.com. New for-sale listings data reflect daily counts using a smoothed, seven-day trailing average. Total for-sale listings, newly pending sales, days to pending and median list price data reflect weekly counts using a smoothed, four-week trailing average. National newly pending sales trends are based upon aggregation of the 38 largest metro areas where historic pending listing data coverage is most statistically reliable, and excludes some metros due to upstream data coverage issues. For more information, visit www.zillow.com/research/. Click here to read past editions of Zillow's Weekly Market Report. The post Zillow Weekly Market Report, Data Through Oct. 31 appeared first on Zillow Research. via Zillow Weekly Market Report, Data Through Oct. 31 https://ift.tt/2IBX0tu The number of days homes are staying on the market remains at a record-low in the face of intense and persistent buyer demand. Sales are at levels not seen since prior to the Great Recession and are expected to remain high, and prices continue to grow quickly. September was the best month for existing home sales since 2006
Time on market matches record lows
Scalding homebuyer demand continues to drive inventory lower
Price growth continues months-long stretch of uninterrupted annual growth
Homeowners that do decide to sell are realizing big gains. Median sale prices rose to $289,625 in the week ending Sept. 19 (the latest week for which sales price data is available), up 12.5% over the same period in 2019. Home value growth expected to continue accelerating in coming months
2020 home sales likely peaked in September, expected to reaccelerate early next year
¹Using the closest daily rates available from the Freddie Mac Primary Mortgage Market Survey. Monthly payments calculated with Zillow's Mortgage Calculator using 20% down payment.MethodologyThe Zillow Weekly Market Reports are a weekly overview of the national and local real estate markets. The reports are compiled by Zillow Economic Research and data is aggregated from public sources and listing data on Zillow.com. New for-sale listings data reflect daily counts using a smoothed, seven-day trailing average. Total for-sale listings, newly pending sales, days to pending and median list price data reflect weekly counts using a smoothed, four-week trailing average. National newly pending sales trends are based upon aggregation of the 38 largest metro areas where historic pending listing data coverage is most statistically reliable, and excludes some metros due to upstream data coverage issues. For more information, visit www.zillow.com/research/. Click here to read past editions of Zillow's Weekly Market Report. The post Zillow Weekly Market Report, Data Through Oct. 31 appeared first on Zillow Research. via Zillow Weekly Market Report, Data Through Oct. 31 https://ift.tt/2IBX0tu 
Julie Bidwell for The Wall Street Journal Anthony and Charlie Champalimaud have a spiritual side. After the couple bought an 18th-century home in Litchfield, Conn., they hired a self-described energy healer to ensure that they would be welcomed by any previous residents. The pair bought the five-bedroom, 3,800-square-foot home in the town’s historic district last year. They paid $900,000 for the 4-acre property, which also includes a 2,000-square-foot carriage house and a woodshed. The healer’s fee was a small splurge of $1,000 following a renovation that cost $150,000. The couple updated the three-level home’s electrical and lighting systems, replastered ceilings, stripped wood paneling and painted. The work transformed the house into a bright family home with a Scandinavian aesthetic, a nod to the Norwegian heritage of Ms. Champalimaud, 36 years old. Outside, the couple planted trees and are making plans for the carriage house. “We both grew up in historic houses and like them for their patina, warmth and craft,” says Mr. Champalimaud, 42. “This house feels grounded. It’s not grand, but the scale and proportions are proper and lovely.” After the renovation, the energy healer performed a ritual using incense, candles and salt to prepare for the home birth of the couple’s daughter, their second child, some three months later. They plan to one day convert their roomy attic into a playroom and two additional bedrooms. The couple’s home is in the landmark historic district of Litchfield, a quaint New England village set in the hills of Northwest Connecticut about two hours from New York City. The area has many second-home residents. The pair were living in a farmhouse in the town when they decided to downsize. They were drawn to their current home’s multiple 12 over 12 windows, its fireplaces and its four-room floor plan—unusual when the house was built, according to the Litchfield Historical Society. The house’s most striking feature may be an original plastered wall decoration of repeating urns and sunbursts in the entrance hall. It was designed to imitate block-print wallpaper. “It’s a bit faded but has stood up pretty well,” says Mr. Champalimaud. At the time it was built, the home was one of the grandest in Litchfield, believed to be the work of master carpenter and architect William Sprats. It was commissioned by Dr. Daniel Sheldon, who lived there until his death at age 90 in 1840, after which his daughter moved in. Behind the home is an original three-seat privy—the only extant example in Litchfield. The 19th-century carriage house has a tack room and stalls. The plan is to restore the first floor and add a climbing wall. The second floor would become a guest apartment. 
Julie Bidwell for The Wall Street Journal The couple is considering buying horses, which are permitted in the town. They also plan to turn a nearby woodshed into a studio. Mr. Champalimaud, speaking about the finishing touches to the home, said the interior colors are meant to be fun. The living room has rose walls with gray trim, the den is teal with a bold blue nook, and the main bedroom is an ocher that complements the woodwork. The décor overall reflects the couple’s love of Midcentury Modern furniture mixed with antiques, folk art—including their collection by Winfred Rembert—and contemporary photography. A Saarinen table and Bertoia Diamond chairs are in the dining area. An early Chinese terra-cotta of a boy with a scythe was purchased from a local estate. The living room features an Old Master painting that hung in Mr. Champalimaud’s grandfather’s house in Estoril, Portugal. The home’s unvarnished wide-plank floors are covered with kilims. 
Julie Bidwell for The Wall Street Journal 
Julie Bidwell for The Wall Street Journal The couple both have extensive experience in historic and cultural preservation. He has developed historic hotels in Europe. She worked for the Nordic World Heritage Foundation in Oslo. Today, Mr. Champalimaud, a managing partner of The Working Group development company, also is an owner of the historic Troutbeck estate hotel some 30 miles away in Amenia, N.Y. That estate was built in 1765, then rebuilt in the early 20th century—after a fire—by Joel Spingarn and his artist wife, Amy Einstein Spingarn, both activists for racial equality. Over the decades, Troutbeck was visited by prominent Americans such as Ralph Waldo Emerson, Henry David Thoreau, W.E.B. DuBois and Ida B. Wells, according to Ms. Champalimaud. She currently heads programming at Troutbeck. Back in Litchfield, another home attributed to a commission by the Sheldon family is for sale. Nearby Sheldon Tavern, built in 1760 and later turned into a 7,242-square-foot private home is on the market for $1.795 million. The post Who Needs a Home Inspector When You Can Hire an Energy Healer? appeared first on Real Estate News & Insights | realtor.com®. via Who Needs a Home Inspector When You Can Hire an Energy Healer? https://ift.tt/3nvDMVZ
More than one-in-five homes sold nationwide in September went for more than the asking price, another example of a seasonal and historical aberration in a year chock full of them — and the latest evidence that sellers have the upper hand in the 2020 housing market. It is not uncommon for certain homes to generate offers above list price. But the frequency with which homes are selling above list price this year is both historically and seasonally unusual. Of all U.S. homes sold in September, 22.4% went for more than their asking price — roughly 50% higher than both the long-term average (14.5%) and for the month of September in both 2019 and 2018 (around 15% in each year), according to a Zillow analysis of sales and list prices. The data point to robust competition and likely bidding wars over the extremely limited supply of homes for buyers to choose from — a home selling above list on its own does not necessarily mean that home received multiple offers, but it's a very strong indicator. Typically, July is the month in which the highest share of homes fetch more than their list price, but September 2020's figure was noticeably higher than July of this year (18.2% of homes sold above list), last year (16.1%) and 2018 (17.7%). In a typical year, the market cools in August and September — but the market accelerated into the early fall this year, defying historical seasonal patterns. If most sellers dream of a bidding war pushing their gains beyond their initial expectations, then the evidence suggests that in a year that has otherwise been filled with nightmares, many home sellers' dreams are nevertheless coming true as we approach the end of the year. Widespread GainsGains in the share of homes sold above list were widespread across both geographies and market segments. Sales above list were most common for homes priced just above and below the typical September U.S. home value of $259,906. Homes priced in the second quintile of all U.S. home listings — between $192,001 and $264,000 — sold above list in 28.2% of September sales. Homes in this price range are also selling incredibly quickly — a recent Zillow analysis of time on market found similarly priced homes typically sold faster than any other price tier in September. Homes priced between $264,001 and $346,000 nationwide, sold above list price 25.9% of the time in September, up from 16.4% in the previous year. And 21.8% of homes in the move-up segment (priced between $346,001 and $487,000) sold above list in September, up from 13.4% a year ago. Because progressively fewer buyers can afford homes at higher price points, it is common for the most expensive homes to generate fewer offers above list price. But even in the premium home segment, there is significant evidence of intense buyer competition. Roughly one-in-six (15.7%) of homes in the most-expensive segment (priced higher than $487,001) sold above list in September, up from 10.5% in 2019 and the highest share sold above list in this price range in any month since at least January 2018, the earliest month included in the analysis. The data also show extraordinary year-over-year changes in buyer behaviors in individual markets that reflect the unprecedented nature of 2020. The share of homes sold above list is up from last month and higher than a year ago in each of the 50 largest U.S. metros, and has more than doubled year-over-year in five of the top 50: Phoenix, San Diego, Denver, Virginia Beach and Riverside. In Phoenix, 27.9% of homes sold above the initial asking price in September, up from 11.8% in the previous year. Market conditions in these markets are clearly markedly different than they were only 12 months ago. Among the top 50 metros, San Francisco had the highest share of homes that sold above list price in September at 48.9%, up from 43.4% in September 2019. That almost half of buyers were able — if perhaps not entirely "willing" — to pay more than the list price in what has perennially been one of the nation's most-expensive housing markets speaks to the complicated relationship between a number of unique local factors, including: The enduring desirability of the area; the high incomes of many willing to pay the price to live there; and the very limited number of homes available to buy in the first place. It could also indicate that sellers may be underestimating the strength of the local market and pricing too conservatively — or, for some savvy sellers, it could validate the strategy of pricing low on purpose, in hopes of generating competition that will drive the ultimate price up. The Bay Area will continue to grapple with huge housing affordability challenges, but its clear that ultra-low mortgage rates are helping local buyers stomach otherwise nosebleed-level prices. A Sense of UrgencyPerhaps unsurprisingly, homes that sold in the shortest amount of time — indicative of more-intense competition for these properties — also were more likely to sell above list. Nationwide, of homes that sold in 10 days or less, an average of 28.5% sold above list since 2018 . The longer homes stayed on the market, the less likely they were to sell above list — although its not unheard of: Among homes that took 60 days to sell, about 10.4% received an offer above list. Potential buyers may be feeling urgency to lock in low mortgage rates while they last, especially if they sense prices will slip further from reach in coming years. Many others may be taking advantage of new freedom to telecommute from an area where they can more easily afford a home. In either case, the housing market is taking us all back to Economics 101 and teaching lessons about supply and demand. There are simply more prospective buyers than sellers right now, and this imbalance is driving prices higher than we typically see at this time of year. Many buyers in the market right now will need to be realistic about the possibility of bidding wars, and leave themselves financial flexibility by looking at homes listed for less than their maximum price point. After a brief freeze in activity in the early months of the coronavirus pandemic, the housing market has been scorching hot throughout the summer — but there are signs of an expected seasonal cooldown as we approach the end of the year. Modest drops in both mortgage applications and pending sales indicate that closed sales are likely to recede somewhat in coming months. Still, with tight inventory, low interest rates, and robust demand from households re-evaluating their housing needs, a competitive market is likely here to stay into 2021 — which may mean many listings are likely to fetch their seller a surprising bonus above their initial expectations.
MethodologyThe share above list price figures reported in this analysis are computed from a matched data set of final sale prices and first list prices. Share above list price by tiers are computed as the three month trailing average of homes that sold above the list price within each sale price quintile. Sale price quintiles and tiers are computed monthly. National figures are computed as an inventory-weighted average of the state-level share of homes sold above list, which is necessary for computational considerations. The post Intense Competition Pushes Share of Homes Selling Above List to Record High appeared first on Zillow Research. via Intense Competition Pushes Share of Homes Selling Above List to Record High https://ift.tt/3eTWOSH
More than one-in-five homes sold nationwide in September went for more than the asking price, another example of a seasonal and historical aberration in a year chock full of them — and the latest evidence that sellers have the upper hand in the 2020 housing market. It is not uncommon for certain homes to generate offers above list price. But the frequency with which homes are selling above list price this year is both historically and seasonally unusual. Of all U.S. homes sold in September, 22.4% went for more than their asking price — roughly 50% higher than both the long-term average (14.5%) and for the month of September in both 2019 and 2018 (around 15% in each year), according to a Zillow analysis of sales and list prices. The data point to robust competition and likely bidding wars over the extremely limited supply of homes for buyers to choose from — a home selling above list on its own does not necessarily mean that home received multiple offers, but it's a very strong indicator. Typically, July is the month in which the highest share of homes fetch more than their list price, but September 2020's figure was noticeably higher than July of this year (18.2% of homes sold above list), last year (16.1%) and 2018 (17.7%). In a typical year, the market cools in August and September — but the market accelerated into the early fall this year, defying historical seasonal patterns. If most sellers dream of a bidding war pushing their gains beyond their initial expectations, then the evidence suggests that in a year that has otherwise been filled with nightmares, many home sellers' dreams are nevertheless coming true as we approach the end of the year. Widespread GainsGains in the share of homes sold above list were widespread across both geographies and market segments. Sales above list were most common for homes priced just above and below the typical September U.S. home value of $259,906. Homes priced in the second quintile of all U.S. home listings — between $192,001 and $264,000 — sold above list in 28.2% of September sales. Homes in this price range are also selling incredibly quickly — a recent Zillow analysis of time on market found similarly priced homes typically sold faster than any other price tier in September. Homes priced between $264,001 and $346,000 nationwide, sold above list price 25.9% of the time in September, up from 16.4% in the previous year. And 21.8% of homes in the move-up segment (priced between $346,001 and $487,000) sold above list in September, up from 13.4% a year ago. Because progressively fewer buyers can afford homes at higher price points, it is common for the most expensive homes to generate fewer offers above list price. But even in the premium home segment, there is significant evidence of intense buyer competition. Roughly one-in-six (15.7%) of homes in the most-expensive segment (priced higher than $487,001) sold above list in September, up from 10.5% in 2019 and the highest share sold above list in this price range in any month since at least January 2018, the earliest month included in the analysis. The data also show extraordinary year-over-year changes in buyer behaviors in individual markets that reflect the unprecedented nature of 2020. The share of homes sold above list is up from last month and higher than a year ago in each of the 50 largest U.S. metros, and has more than doubled year-over-year in five of the top 50: Phoenix, San Diego, Denver, Virginia Beach and Riverside. In Phoenix, 27.9% of homes sold above the initial asking price in September, up from 11.8% in the previous year. Market conditions in these markets are clearly markedly different than they were only 12 months ago. Among the top 50 metros, San Francisco had the highest share of homes that sold above list price in September at 48.9%, up from 43.4% in September 2019. That almost half of buyers were able — if perhaps not entirely "willing" — to pay more than the list price in what has perennially been one of the nation's most-expensive housing markets speaks to the complicated relationship between a number of unique local factors, including: The enduring desirability of the area; the high incomes of many willing to pay the price to live there; and the very limited number of homes available to buy in the first place. It could also indicate that sellers may be underestimating the strength of the local market and pricing too conservatively — or, for some savvy sellers, it could validate the strategy of pricing low on purpose, in hopes of generating competition that will drive the ultimate price up. The Bay Area will continue to grapple with huge housing affordability challenges, but its clear that ultra-low mortgage rates are helping local buyers stomach otherwise nosebleed-level prices. A Sense of UrgencyPerhaps unsurprisingly, homes that sold in the shortest amount of time — indicative of more-intense competition for these properties — also were more likely to sell above list. Nationwide, of homes that sold in 10 days or less, an average of 28.5% sold above list since 2018 . The longer homes stayed on the market, the less likely they were to sell above list — although its not unheard of: Among homes that took 60 days to sell, about 10.4% received an offer above list. Potential buyers may be feeling urgency to lock in low mortgage rates while they last, especially if they sense prices will slip further from reach in coming years. Many others may be taking advantage of new freedom to telecommute from an area where they can more easily afford a home. In either case, the housing market is taking us all back to Economics 101 and teaching lessons about supply and demand. There are simply more prospective buyers than sellers right now, and this imbalance is driving prices higher than we typically see at this time of year. Many buyers in the market right now will need to be realistic about the possibility of bidding wars, and leave themselves financial flexibility by looking at homes listed for less than their maximum price point. After a brief freeze in activity in the early months of the coronavirus pandemic, the housing market has been scorching hot throughout the summer — but there are signs of an expected seasonal cooldown as we approach the end of the year. Modest drops in both mortgage applications and pending sales indicate that closed sales are likely to recede somewhat in coming months. Still, with tight inventory, low interest rates, and robust demand from households re-evaluating their housing needs, a competitive market is likely here to stay into 2021 — which may mean many listings are likely to fetch their seller a surprising bonus above their initial expectations.
MethodologyThe share above list price figures reported in this analysis are computed from a matched data set of final sale prices and first list prices. Share above list price by tiers are computed as the three month trailing average of homes that sold above the list price within each sale price quintile. Sale price quintiles and tiers are computed monthly. National figures are computed as an inventory-weighted average of the state-level share of homes sold above list, which is necessary for computational considerations. The post Intense Competition Pushes Share of Homes Selling Above List to Record High appeared first on Zillow Research. via Intense Competition Pushes Share of Homes Selling Above List to Record High https://ift.tt/3eTWOSH 
Erin Culton As a wave of urban transplants heads for America’s suburbs and small towns, those areas could find themselves undergoing a dramatic makeover. The coronavirus pandemic has driven many well-off residents out of the cities, with their overpriced and cramped apartments, and toward less populated areas where they can find more space for less money. People leave cities for the suburbs all the time, but this year’s circumstances are forcing even die-hard urbanites to give up on city living. And many are going to want to re-create some aspects of the cities they left behind in their new hometowns. President Donald Trump and President-elect Joe Biden battled for the suburban vote in this election cycle. But while those communities were once synonymous with white flight, they have become increasingly diverse in recent years as more immigrants and millennials have moved in. The latest wave of buyers—mostly older millennials, including families, and Gen X couples—is likely to accelerate the pace of change in the suburbs. “People are already voting with their feet and with their dollars,” says Ed McMahon, a senior fellow at the Urban Land Institute. The nonprofit group researches real estate and land use issues. “The drive-everywhere-for-everything suburb is not going to do as well as those that are walkable and have invested in quality of life, cultural, and recreational amenities. Young people, in particular, want suburbs that give them the best aspects of cities, that have access to parks.” How will urban transplants change the suburbs?To the extent that these new residents can’t find their beloved urban amenities in the vicinity of their big house with a yard, they’re going to want to create them. They’ll become involved in local community groups, boards, and planning commissions. They’ll encourage the kinds of businesses they like to open up, and they’ll support the kinds of community initiatives that will create the amenities they want. “The suburbs are going to change,” says McMahon. “You’re going to see more parks and green space in the suburbs, because people are more interested in running and health-inducing activities. … You’re going to see a lot more housing choices.” Over the past few years, he’s seen dull office parks reimagined as shared workspaces—with housing, dining, and entertainment in the same complex. Zoning changes could allow more housing to go up in the town’s retail and dining centers. Popular businesses, like food halls and bars offering pingpong tables and video games, could move in. Experts expect different kinds of housing to rise to meet the growing demand. That could add more affordable options, such as townhouses, duplexes, and condo buildings to towns made up of seas of single-family houses with crisp, green lawns. “Suburbs in the past had no center, had no edge. You didn’t know where the city ended and the countryside began,” says McMahon. Forward-thinking suburban communities are building city centers, he adds. “They’re trying to create a sense of place.” Which suburbs will do the best—and the worst?The towns that become popular destinations for new residents will likely see higher home values, more tax dollars, and as a result, stronger local economies. Before the pandemic, urbanites leaving the cities sought out walkable towns with smaller homes, shorter commutes, and lots of places to eat and drink, says Alison Bernstein, founder and president of the Suburban Jungle, which offers advice to people seeking a move to the suburbs. Today, folks also want to feel like they’re on vacation once they switch off their work computer in their home office. That means having things like public golf courses, hiking and cycling trails, or beaches nearby, Bernstein says. “A lot of people are going fully remote,” says Bernstein, describing their mindset as “if I can live anywhere, I can get a new-construction house for a quarter of what I’m paying—and I can get a better tax situation.” She’s seeing many younger families move from the East Coast to Florida, with its lower taxes and cost of living. They’re seeking out towns like Boca Raton and Parkland, as well as homes in Denver and Austin, TX. These younger, urban buyers care more about the areas they are moving into, and the lifestyle they offer, than the homes they’re purchasing. “The character of the neighborhood is more important than whether you have granite countertops,” says the Urban Land Institute’s McMahon. The most successful towns will have unique identities and be adept at leveraging their selling points, such as green space, walkability, and farmers markets, says Brett Schwartz. He is the associate director of the National Association of Development Organizations Research Foundation, an umbrella group of suburban and small-town regional planning commissions. They’ll also need friendly residents and stable broadband infrastructure, he says. It will be hard to attract professionals working remotely and new business owners to more rural areas with dial-up internet connections and spotty cellphone signals. “The small towns and suburban communities that are welcoming … are the communities that are going to be able to thrive,” says Schwartz. The downsides could be overburdened infrastructure, such as more traffic and congested schools. And while rising home prices will be good for homeowners, locals trying to buy their first home could have a tough time. Will city slickers stay in the burbs—or return to the big cities?Once there’s a cure for COVID-19, businesses reopen fully, and white-collar professionals feel safe returning to their offices, at least some of these newly minted suburbanites will likely move back to the cities they loved. But the majority are likely to stay right where they are. After all, selling a home after just a couple of years means risking a loss. “The longer it takes for the world to go back to normal, the more people will stay where they’ve migrated to,” says realtor.com® Chief Economist Danielle Hale. “But I don’t think they’ll necessarily keep everyone.” Plus, they’re likely to have begun putting roots down in their new communities, says Jason Hickey, president of Hickey & Associates. The New York City–based business helps companies determine where to expand and if they should relocate. “They would have made the purchase of their home and enrolled their children into the school system,” he says. However, some of this will hinge on employers. Even workers required to go back to their offices may not have to commute very far. Many companies are looking into opening smaller, satellite offices in the suburbs where their workers are based, says Hickey. “Right now many people are 100% remote or very close to 100% remote,” says Hale. “If that changes in the future, more people will want to go back to the city and try to minimize their commute.” The future of local businesses could also affect the trajectory of residents. If restaurants and bars are forced to close because they can’t make ends meet during the pandemic, that will make these communities less desirable. “People would be less likely to stay if an area loses a lot of things that brought people in in the first place, like local businesses,” says Hale. The post Buyers Say Bye-Bye to the City: Are the Suburbs Ready for a Massive Makeover? appeared first on Real Estate News & Insights | realtor.com®. via Buyers Say Bye-Bye to the City: Are the Suburbs Ready for a Massive Makeover? https://ift.tt/2Is9i83 |

AuthorHi, I'm Parker Stiles, the founder of Barrington Acquisitions. I truly hope you enjoy our real estate tips! ArchivesCategoriesLet's connect!

|

 RSS Feed
